60+ Distinct Complications
To conserve battery live, complications are updated once a day and represent values at noon. Tapping on any complication will automatically take you to that trait’s group in the BioMate app and display its value for the current time.
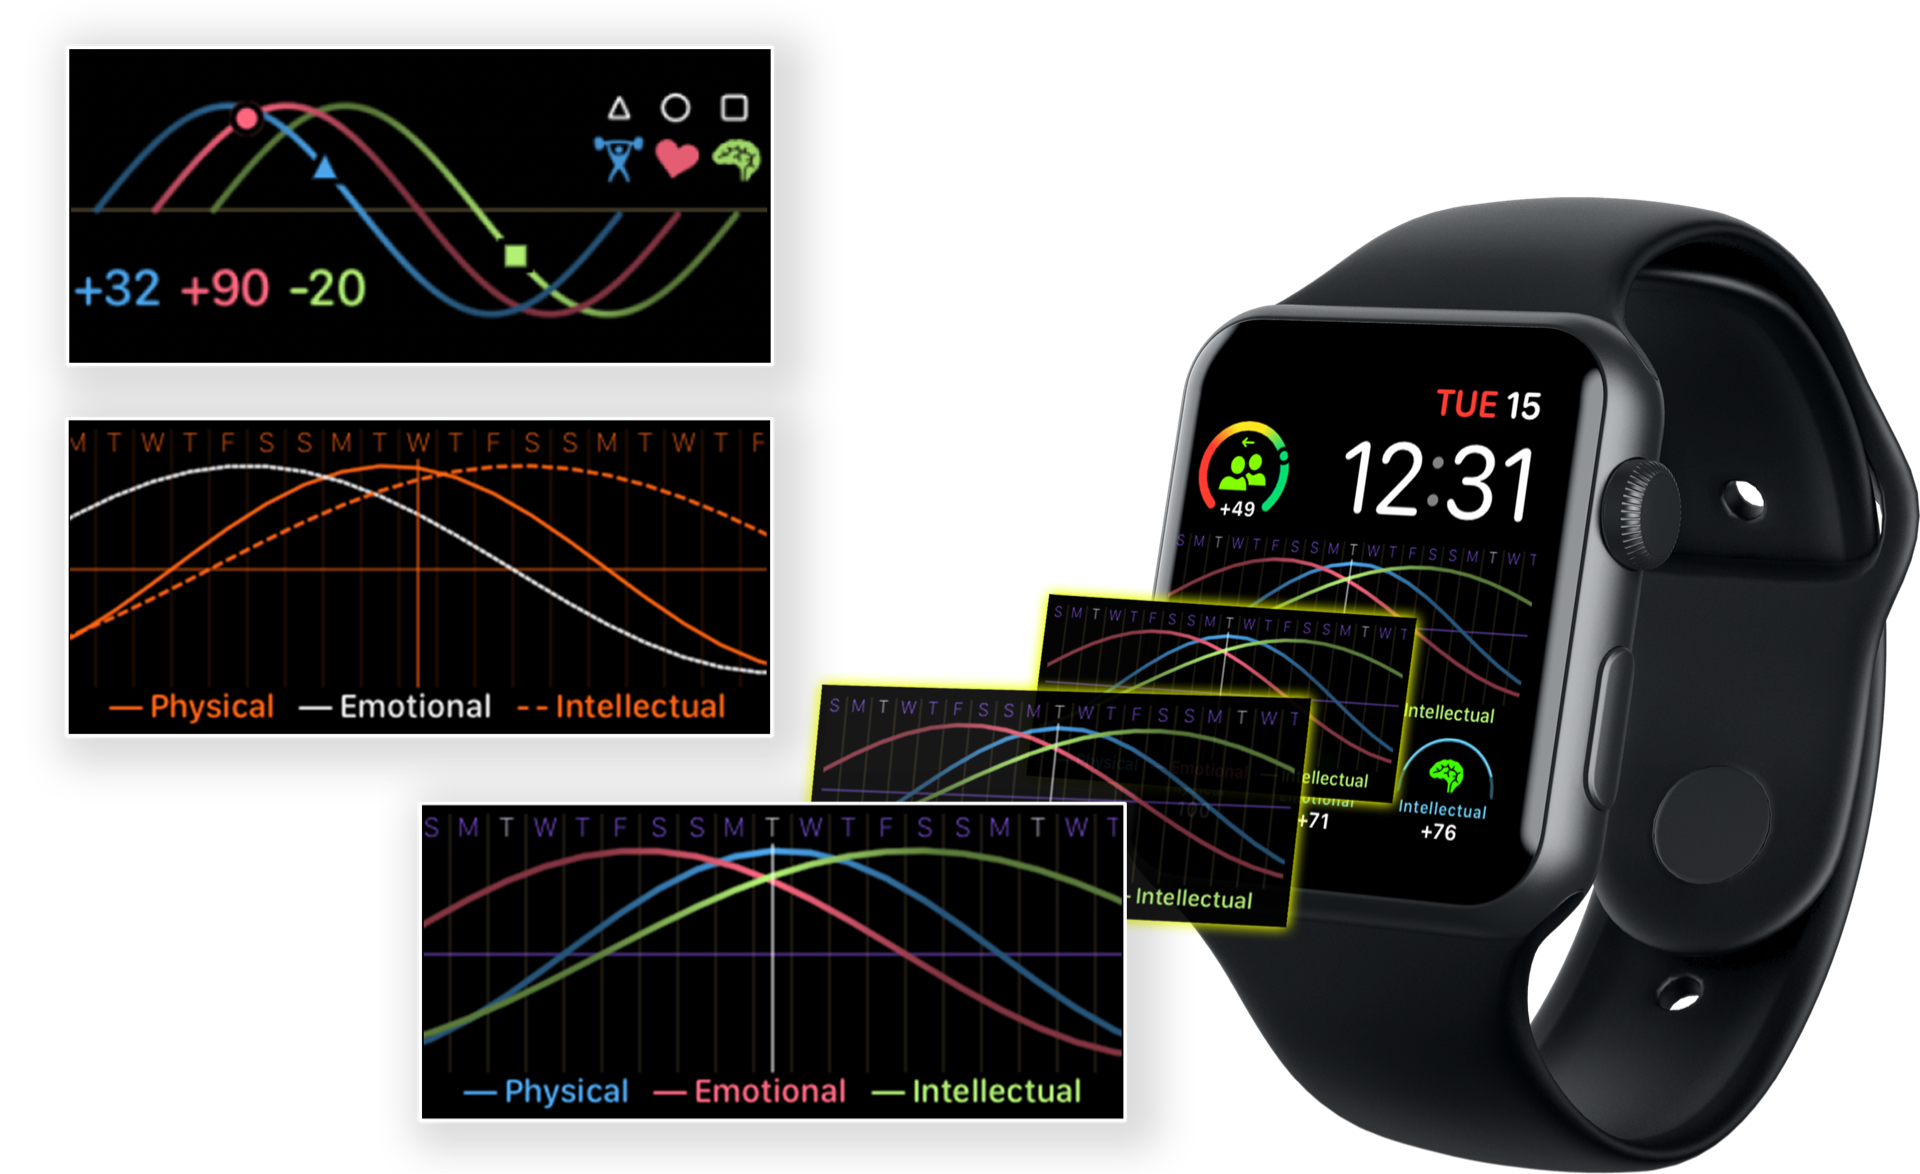
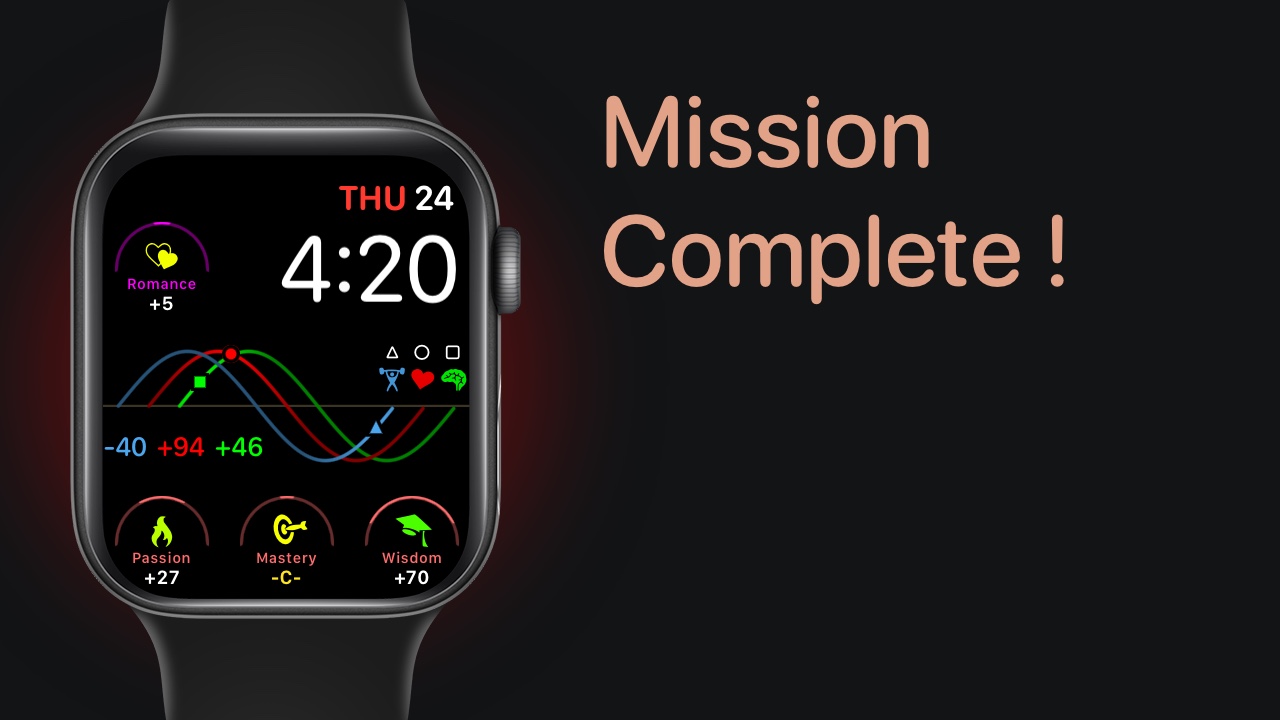
Similar to the App, graph complications display three traits for each group.
The Primary group also has a ‘Fixed Cycle’ display that shows you the complete cycle for each biorhythm along with the respective value and icon.
The line colors for each trait can be changed in the BioMate watch settings when your complication is in multi-color mode. Otherwise the user-defined tint color is used.
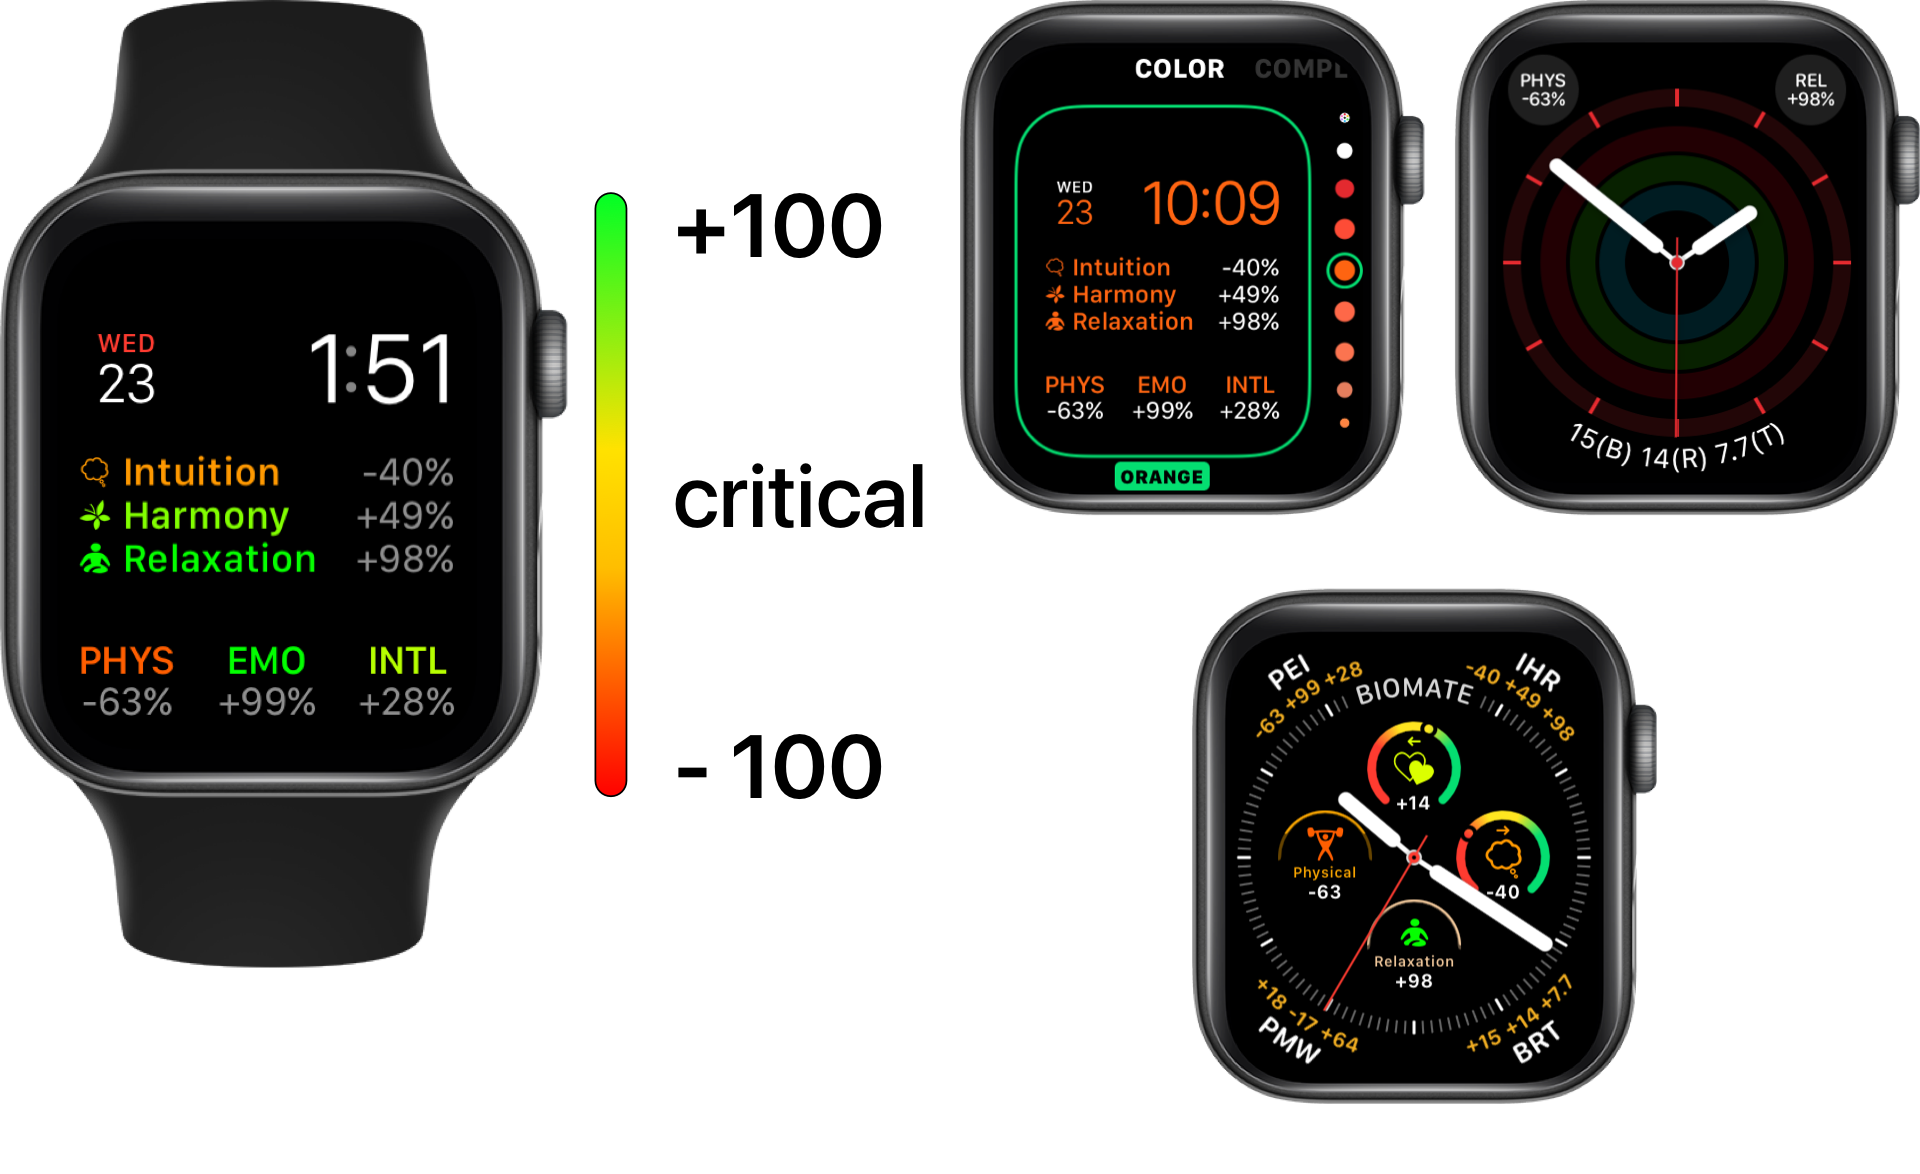
On Modular watch faces, the text category can display both individual and grouped traits.
In multicolor mode, the color of the text changes depending on the trait’s value. Analog watch faces can display single traits in the corners and a grouped set of trait values along the bottom, but do not change color.
Inforgraph watch faces can provide group values in all four corners allowing you display all 12 traits on a single watch face!
Icons can replace the corner text complications on simple watch faces or those that have a specific purpose such as the Activity Analog, Chronograph, and Utility watch faces. On multicolor modular complications, the color of the icon changes depending on the trait’s value.
Half Gauge complications can be placed on Infograph and Infograph Modular watch faces.
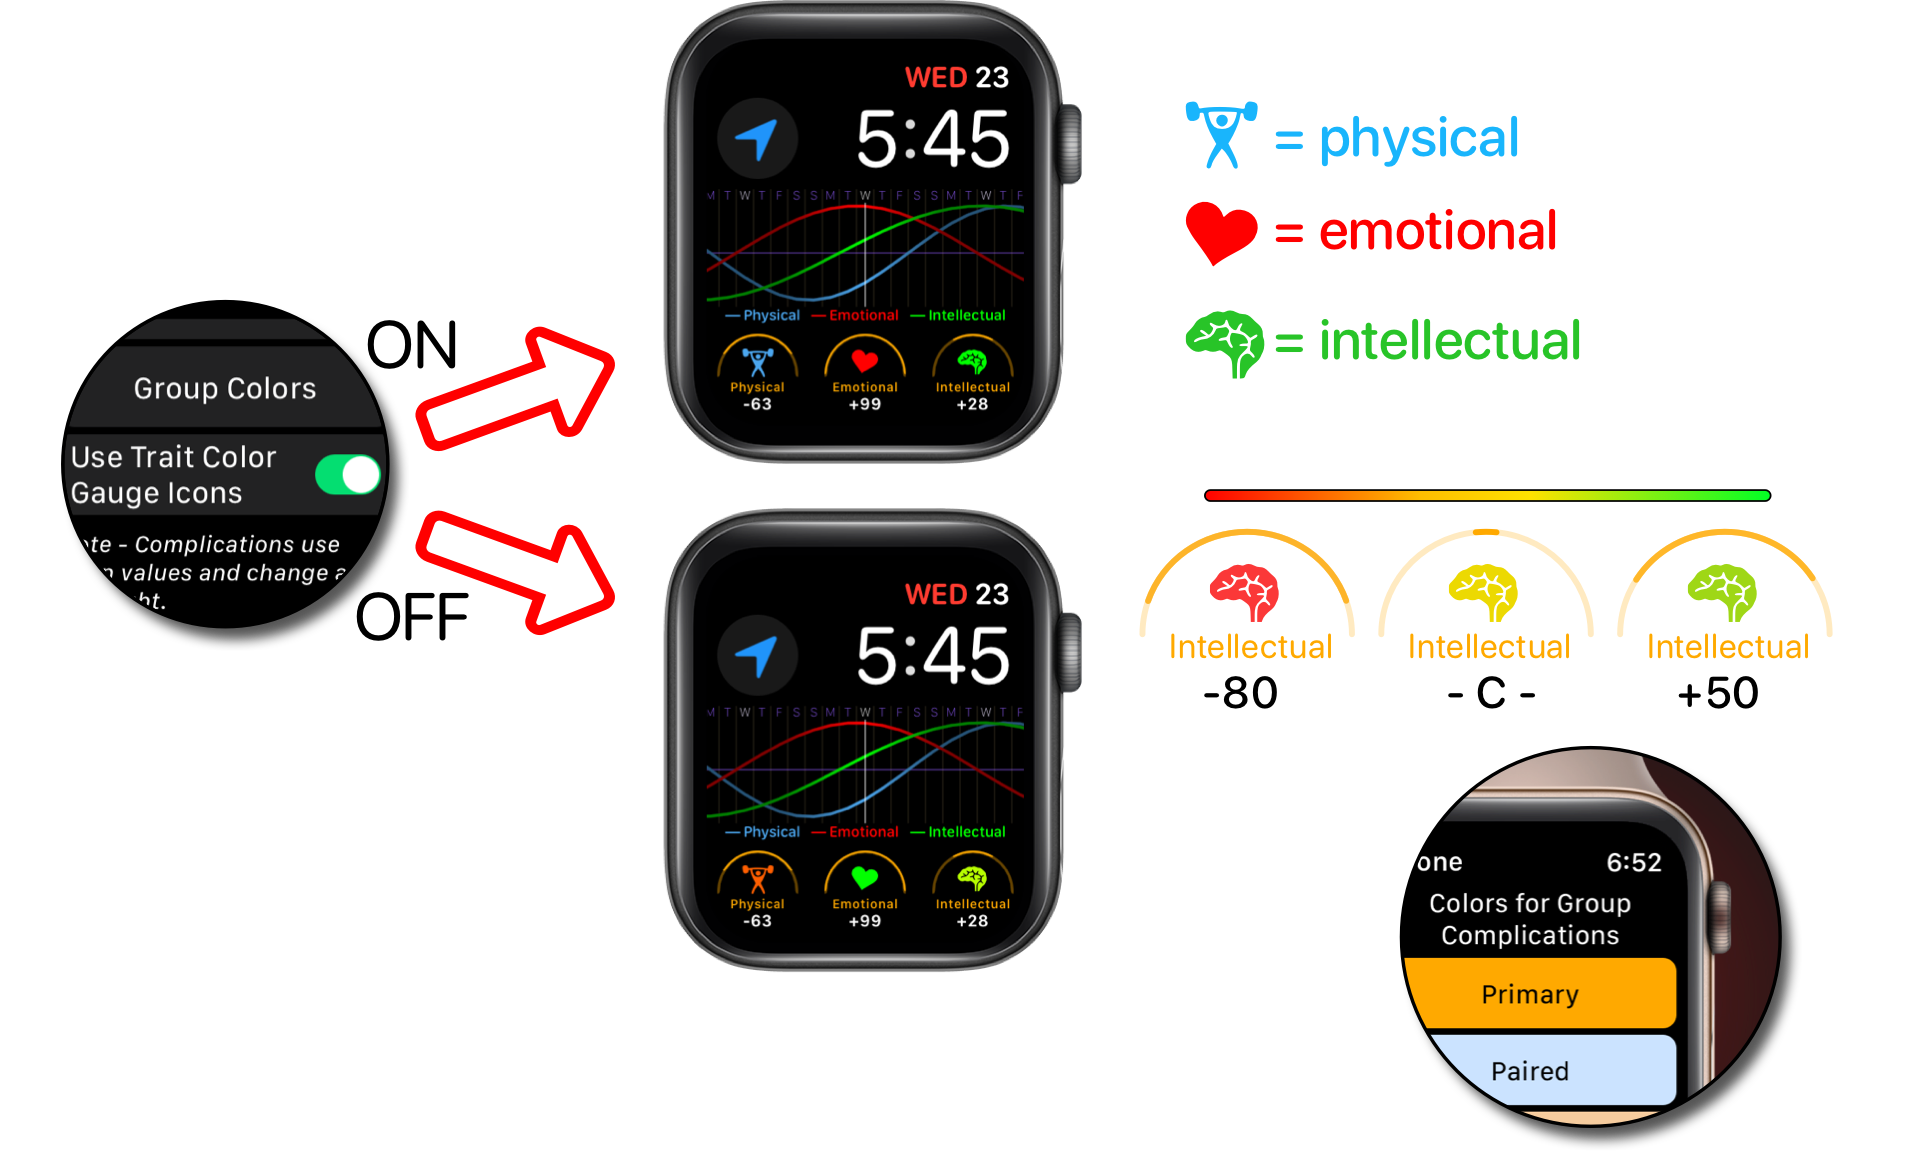
They compliment watch faces with a BioMate Graph so that both the graph and the three trait values can be displayed. The icons can change color based on the trait’s value, but when placed on a watch face with a graph, it’s best to turn on the ‘Use Trait Color Gauge Icons’ option in the BioMate watch app settings. This will match up the gauge icon colors with the trait lines on the graph.
The color of the (gauge) line and text represent the trait group (primary, paired, divine, shared) and can be changed in the app’s settings. Around critical days (-C-), the line is barely filled, while on peak days (+100, -100) the line will be full.
To see if your cycle’s value is increasing or decreasing, tap on the gauge to display the real-time graph and values in the BioMate app.
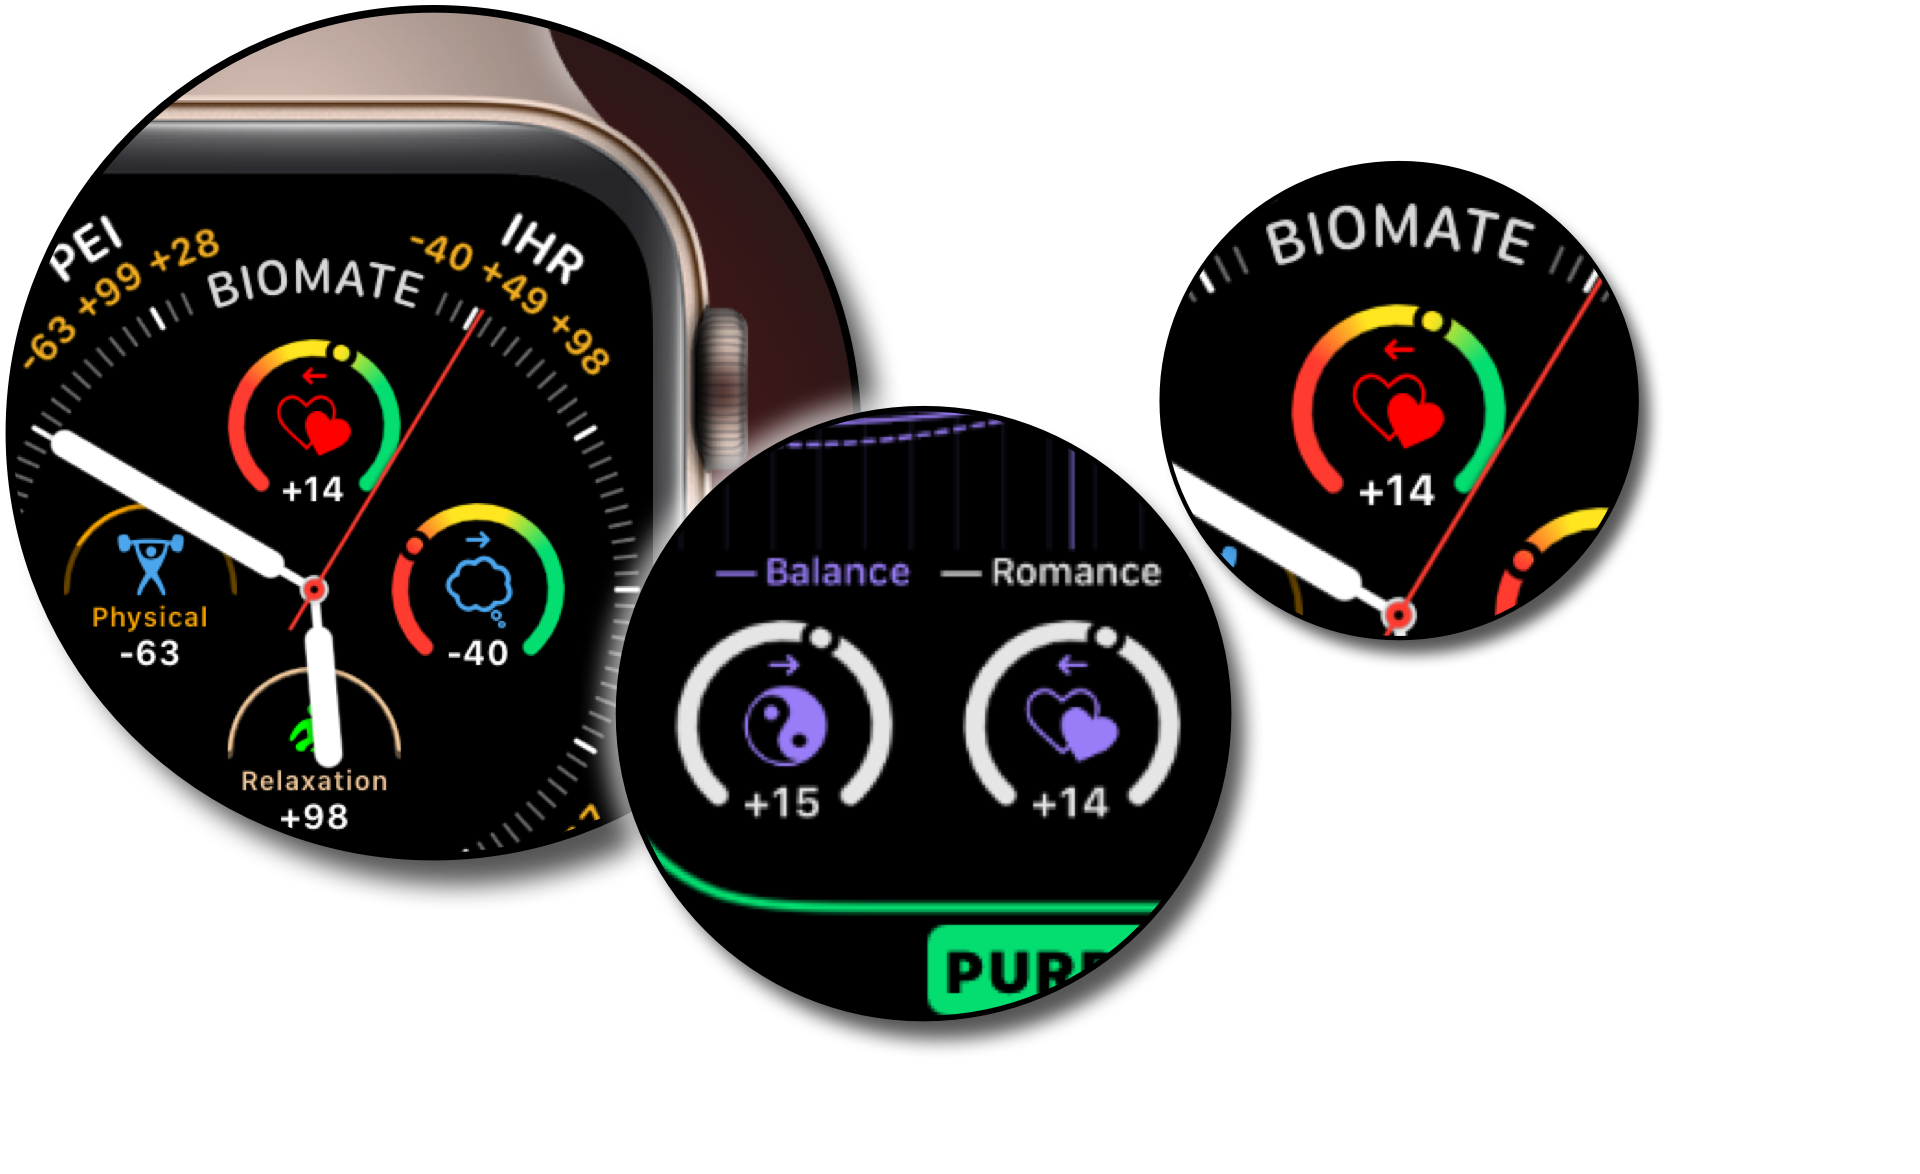
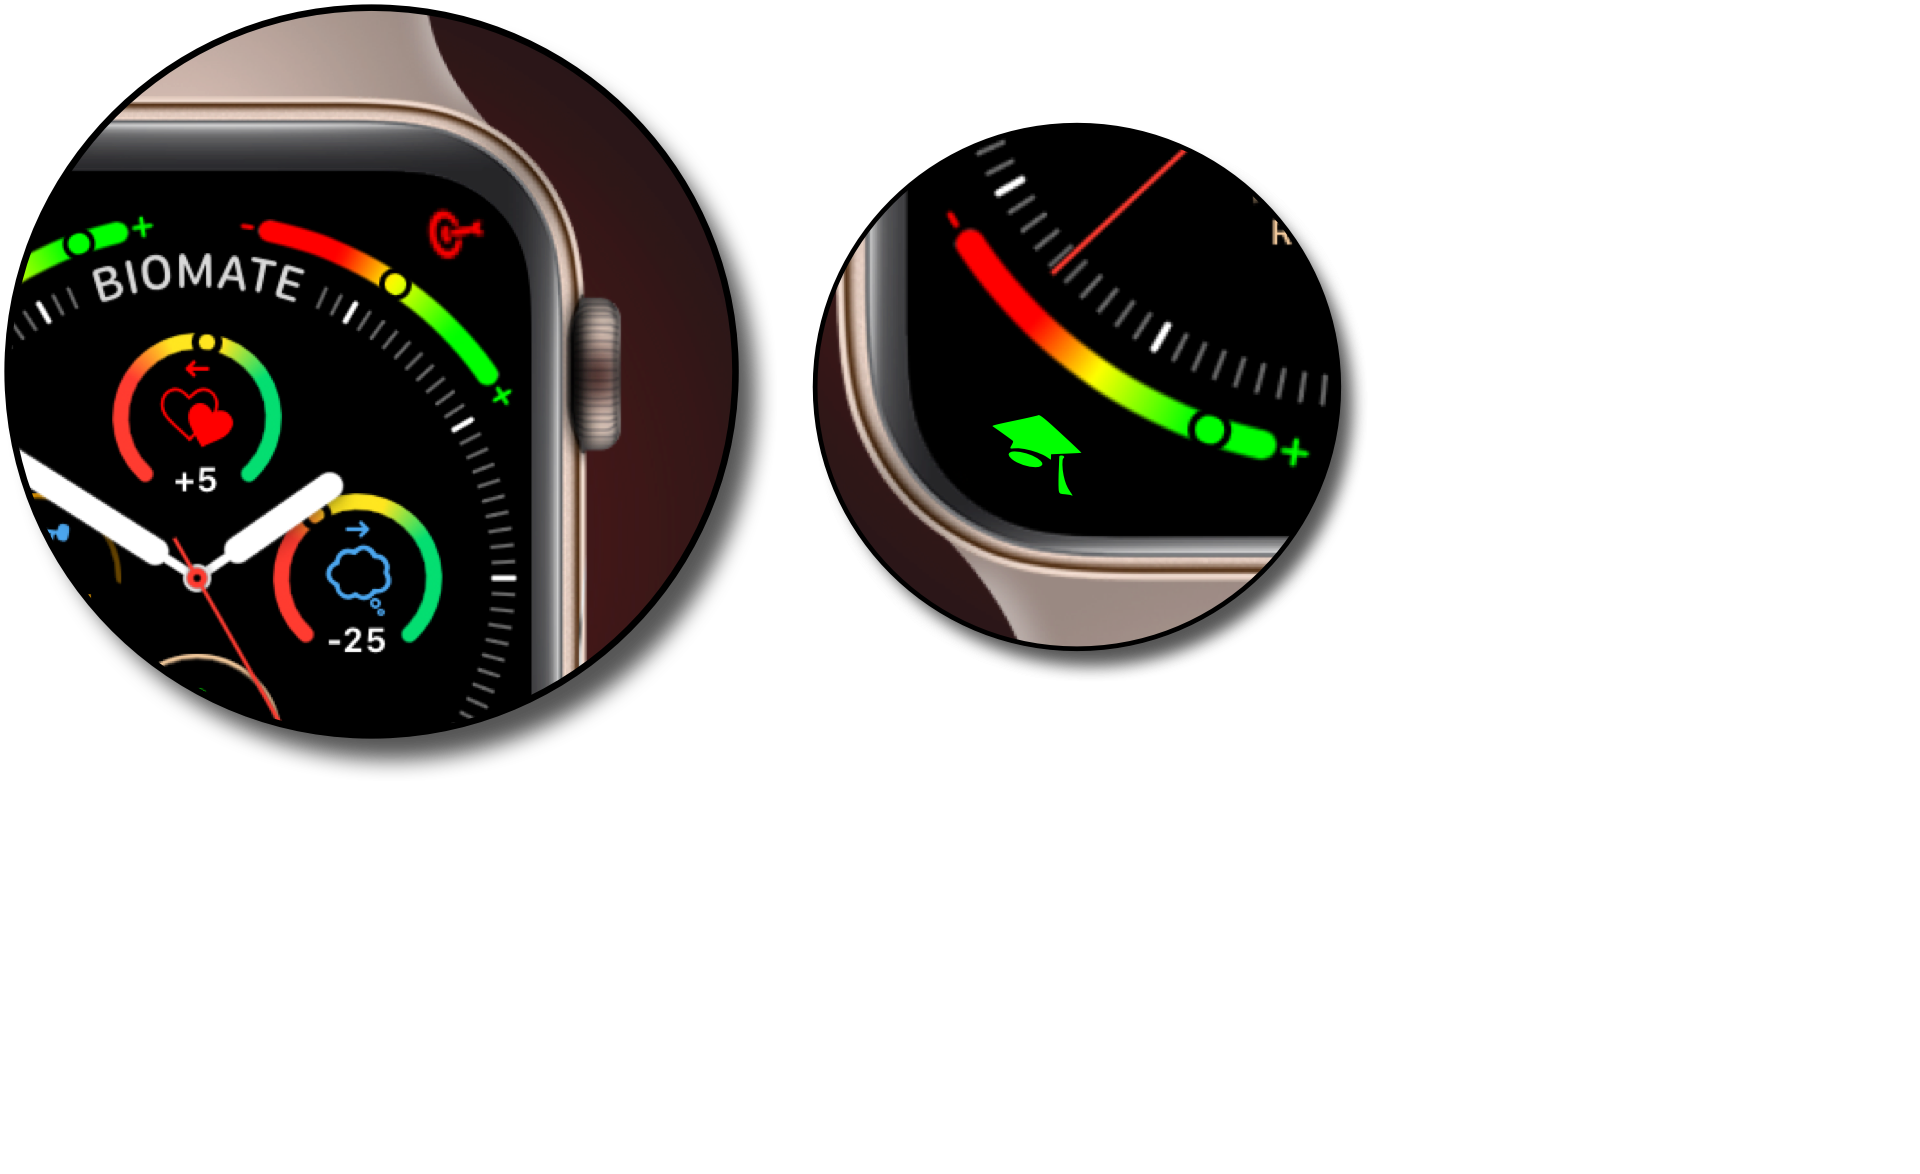
Infograph and Infograph Modular watch faces can use BioMate Full Gauge complications.
Full gauges are traits that have a range from -100 to +100 with a bubble marker that increases in value clockwise from left to right. An arrow above the trait’s icon indicates whether the value is increasing or decreasing.
The value for critical days is marked as ‘-C-‘ and the icon color (like Half Gauge complications), will reflect the value if this setting is turned ON in the BioMate app’s watch settings.
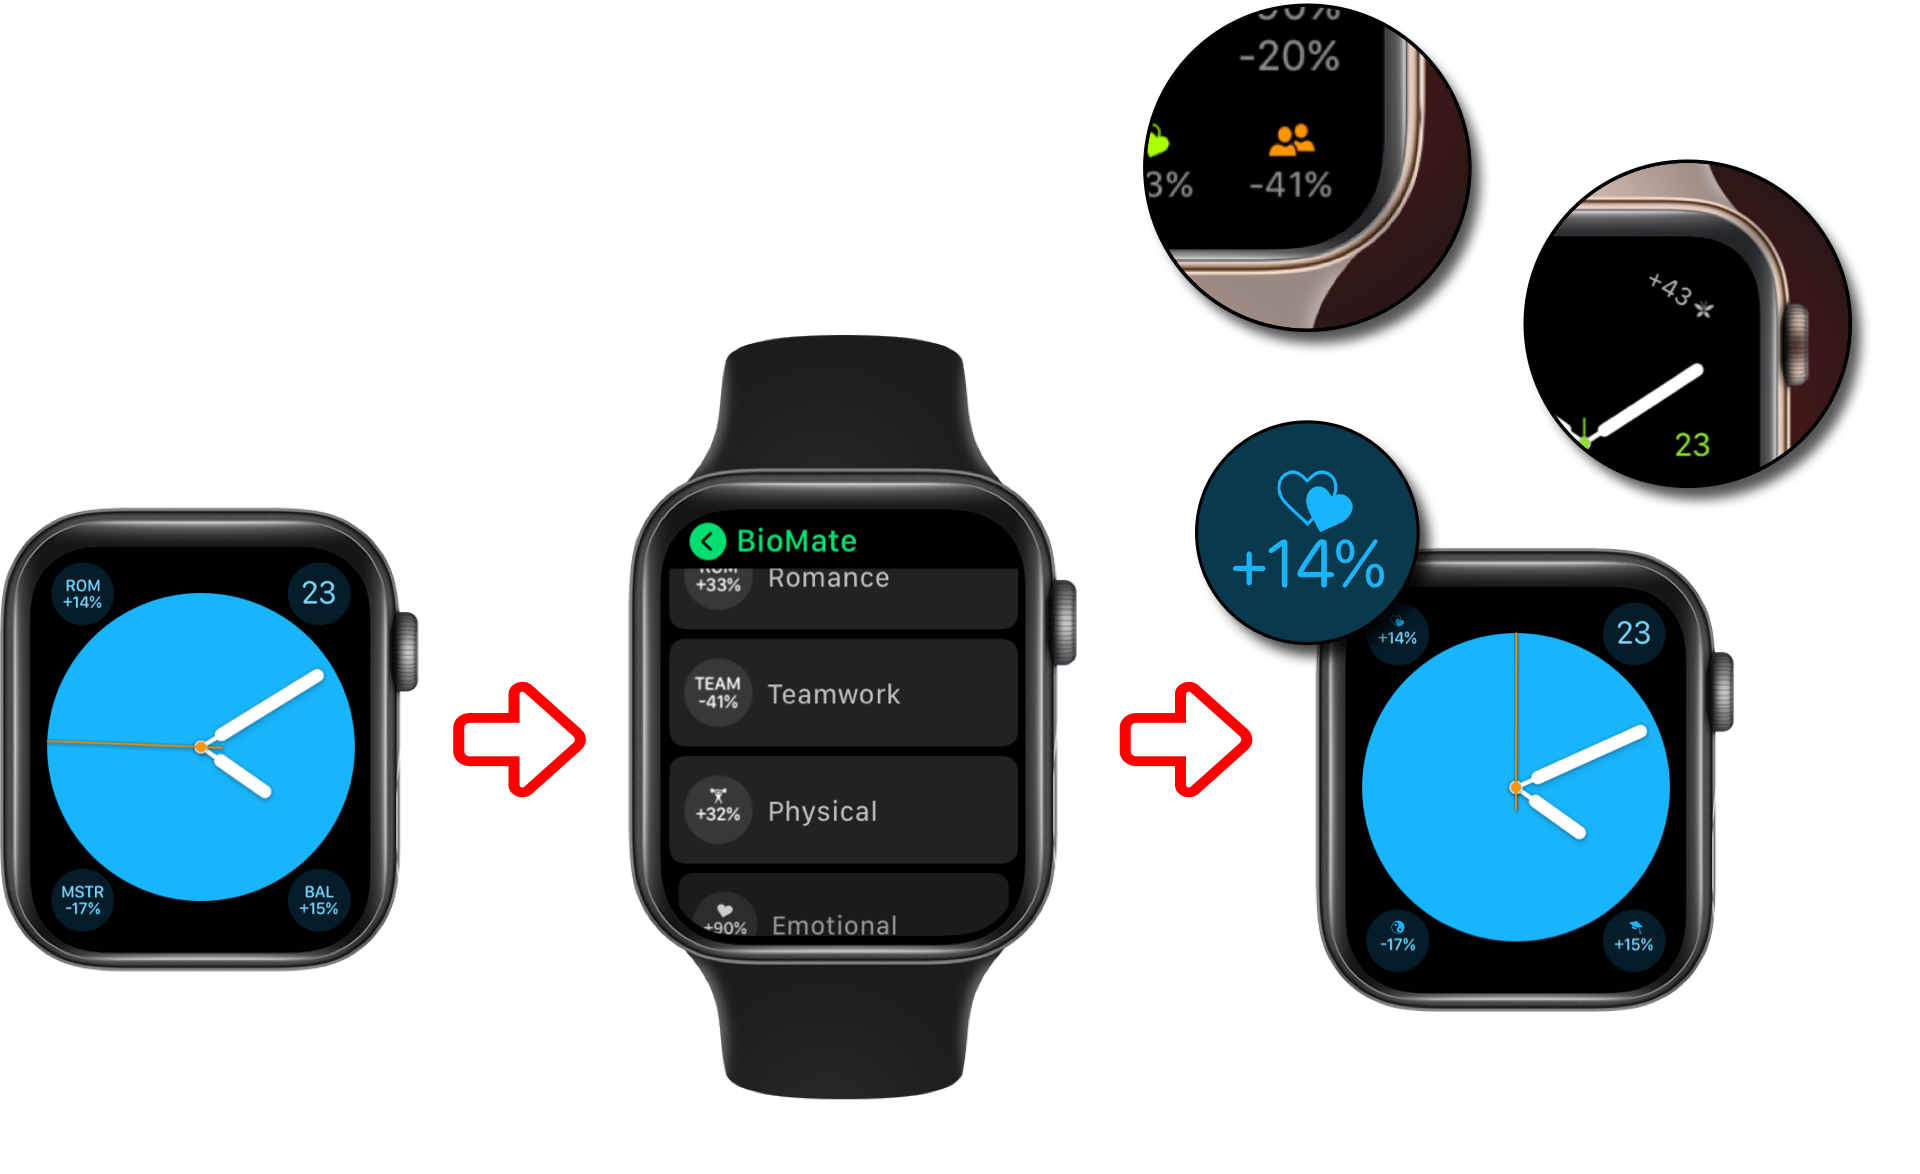
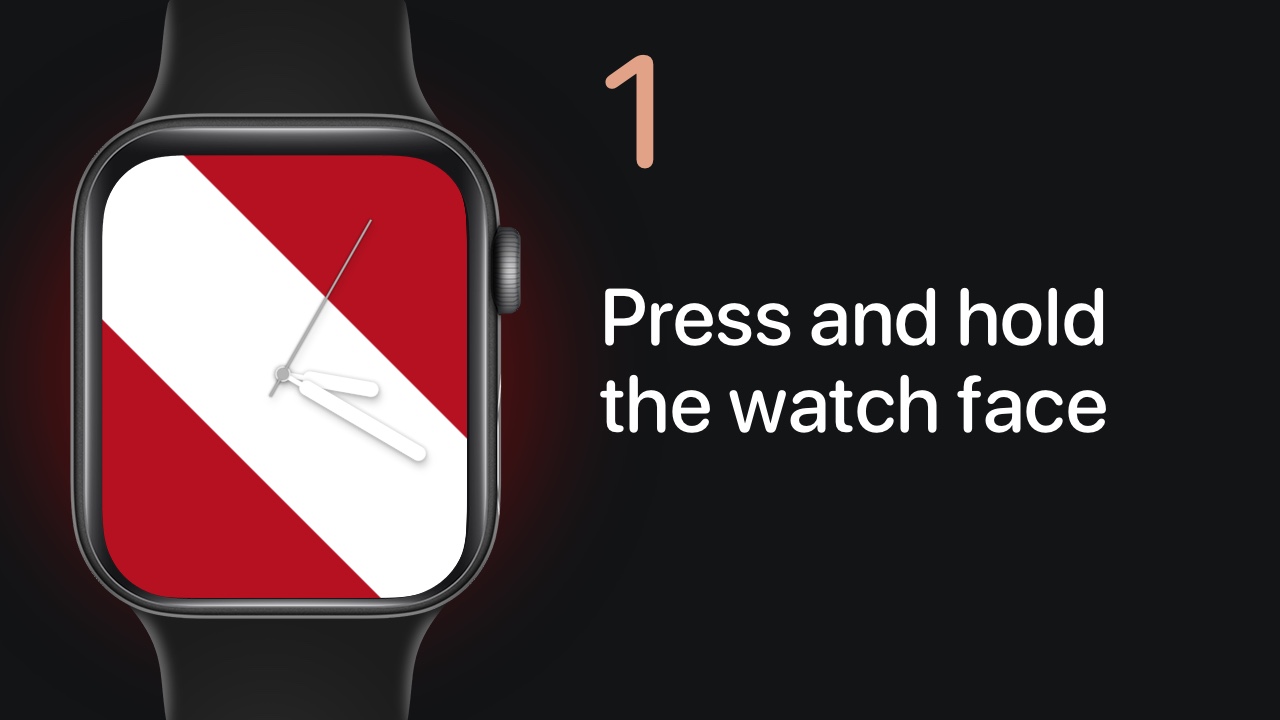
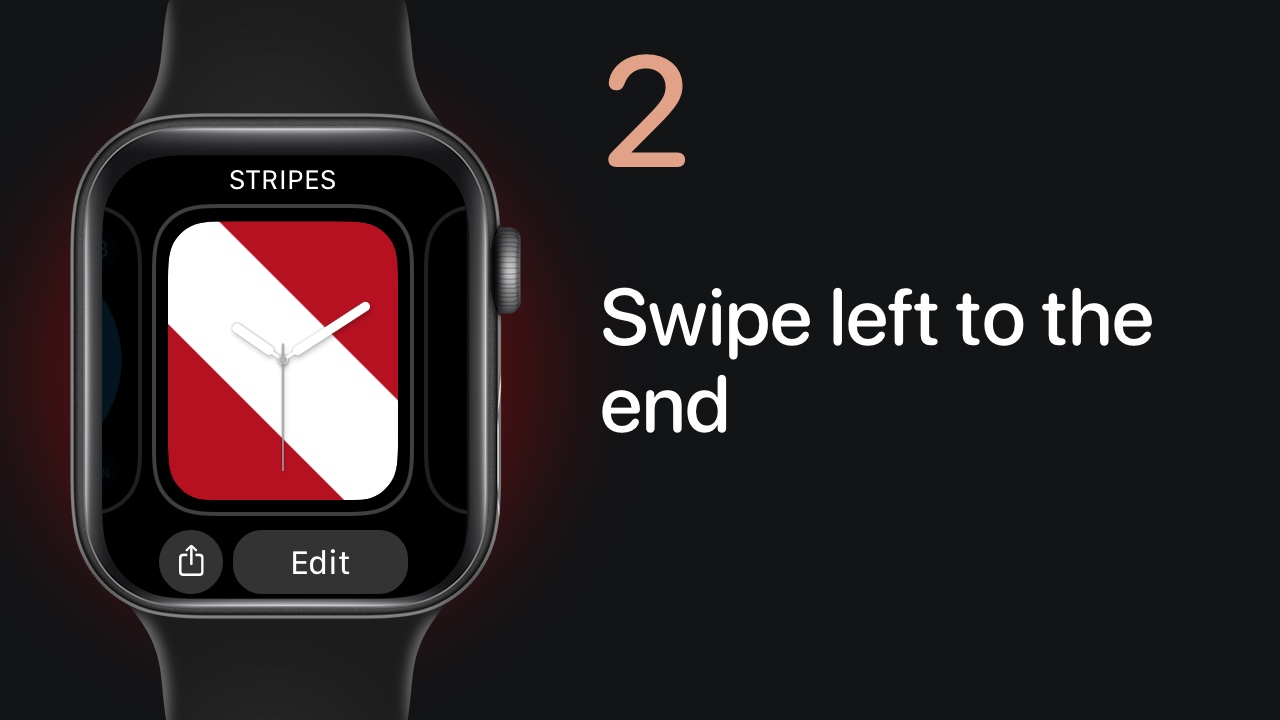
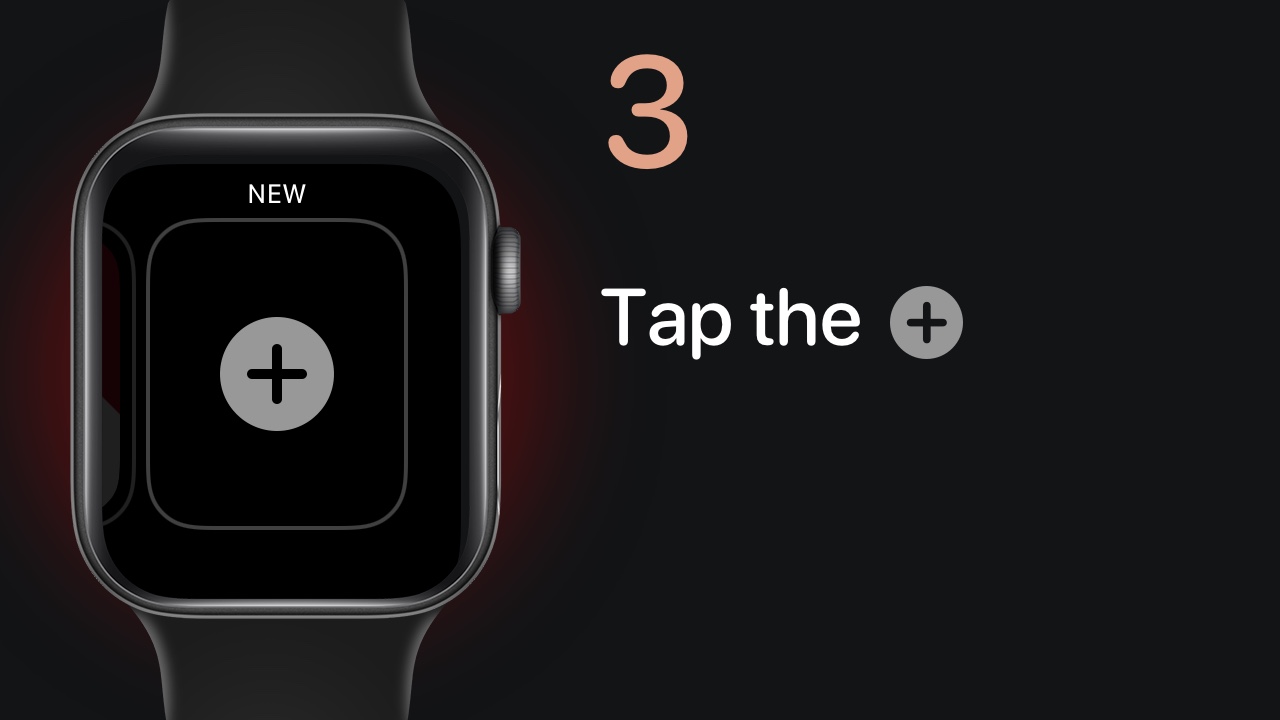
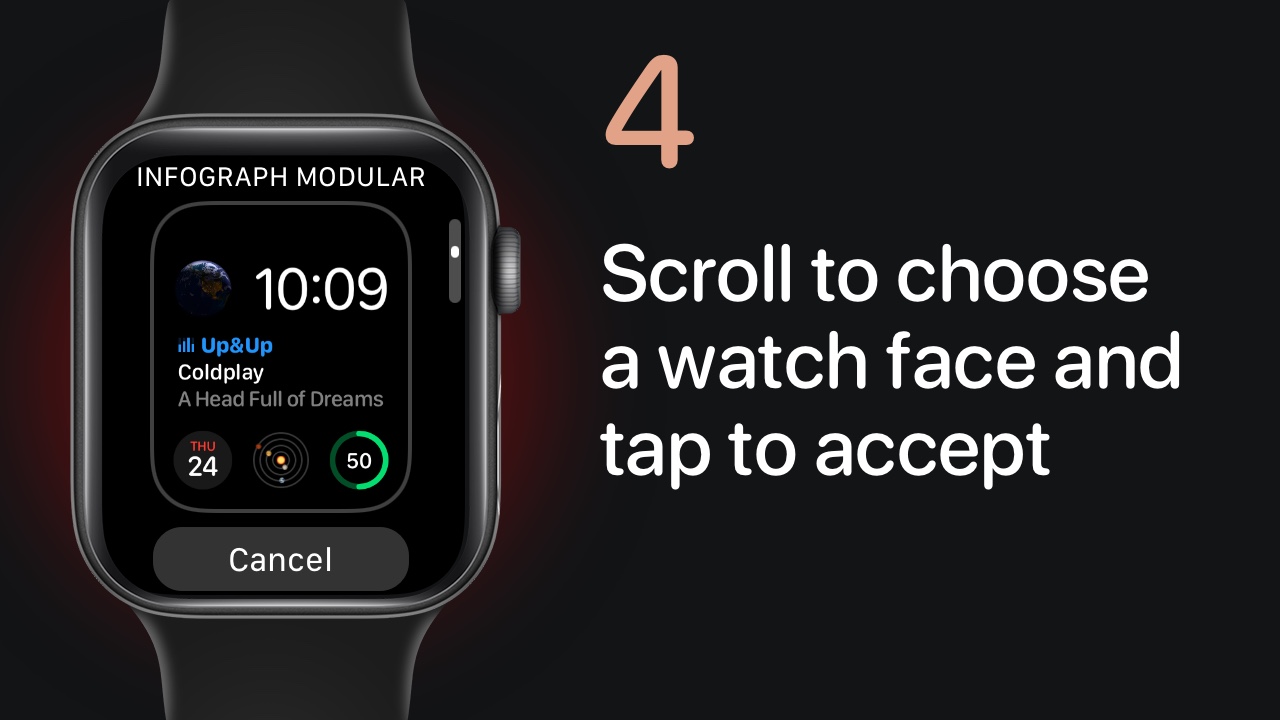
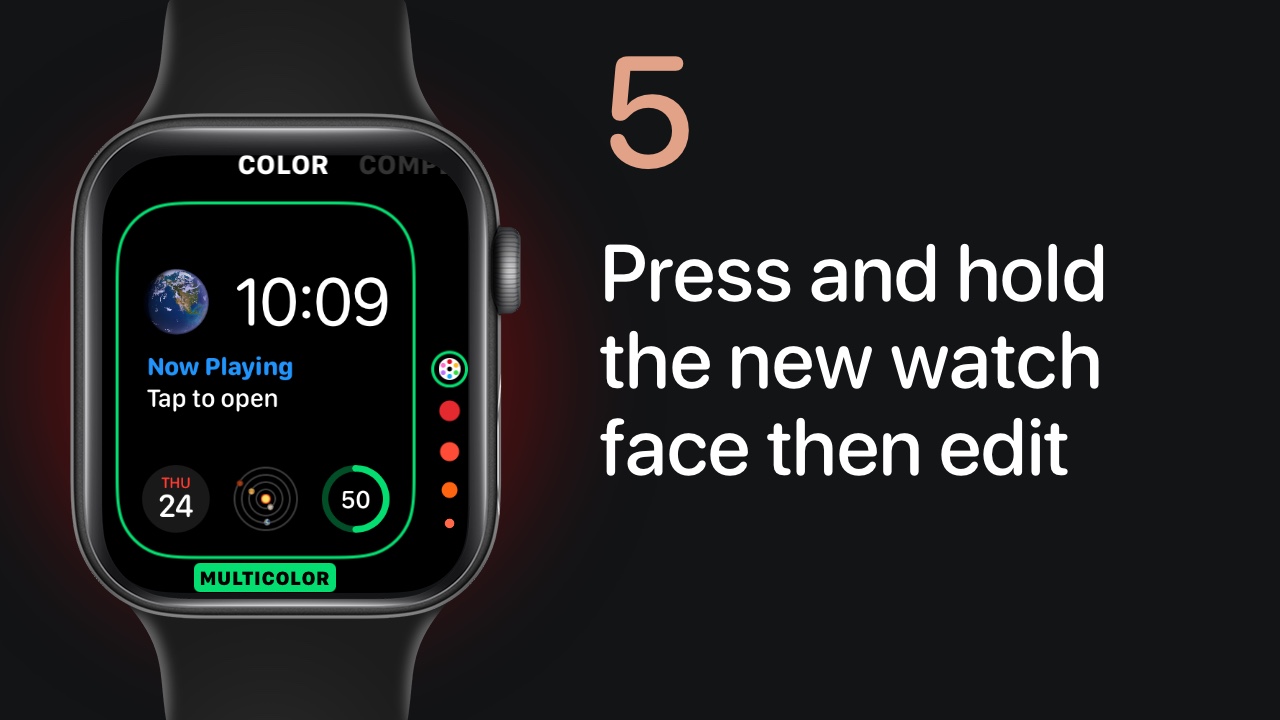
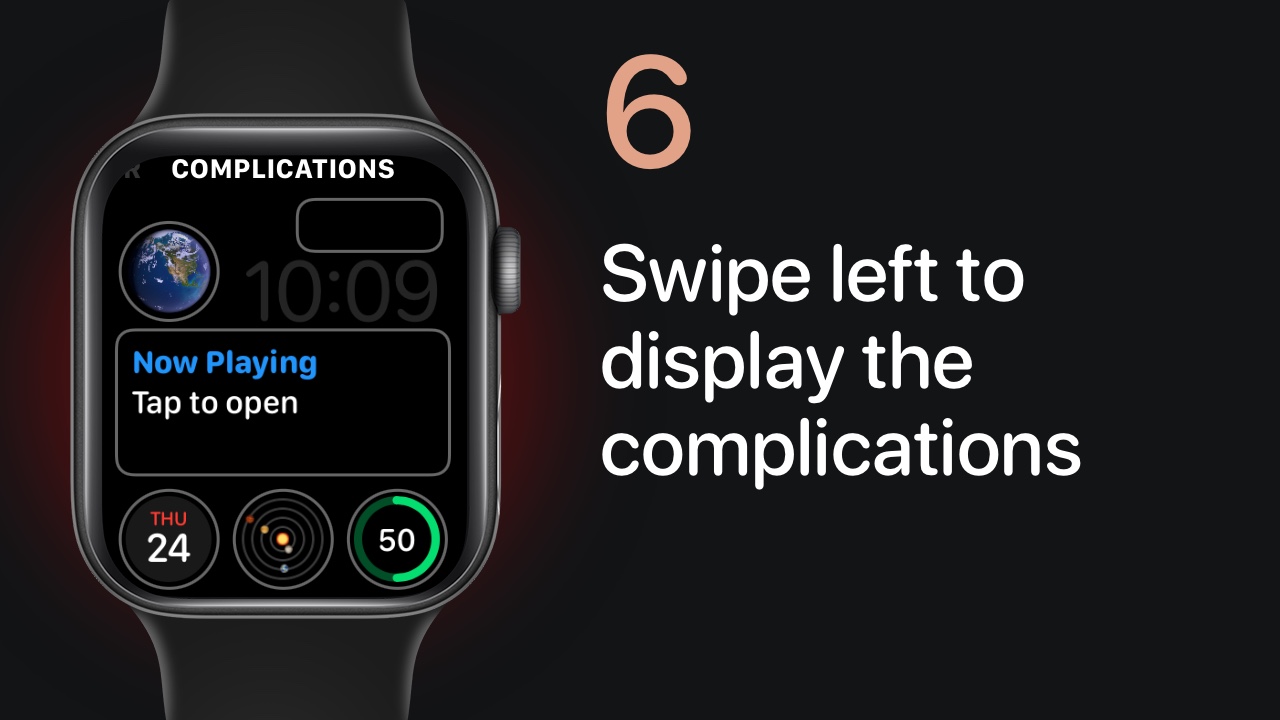
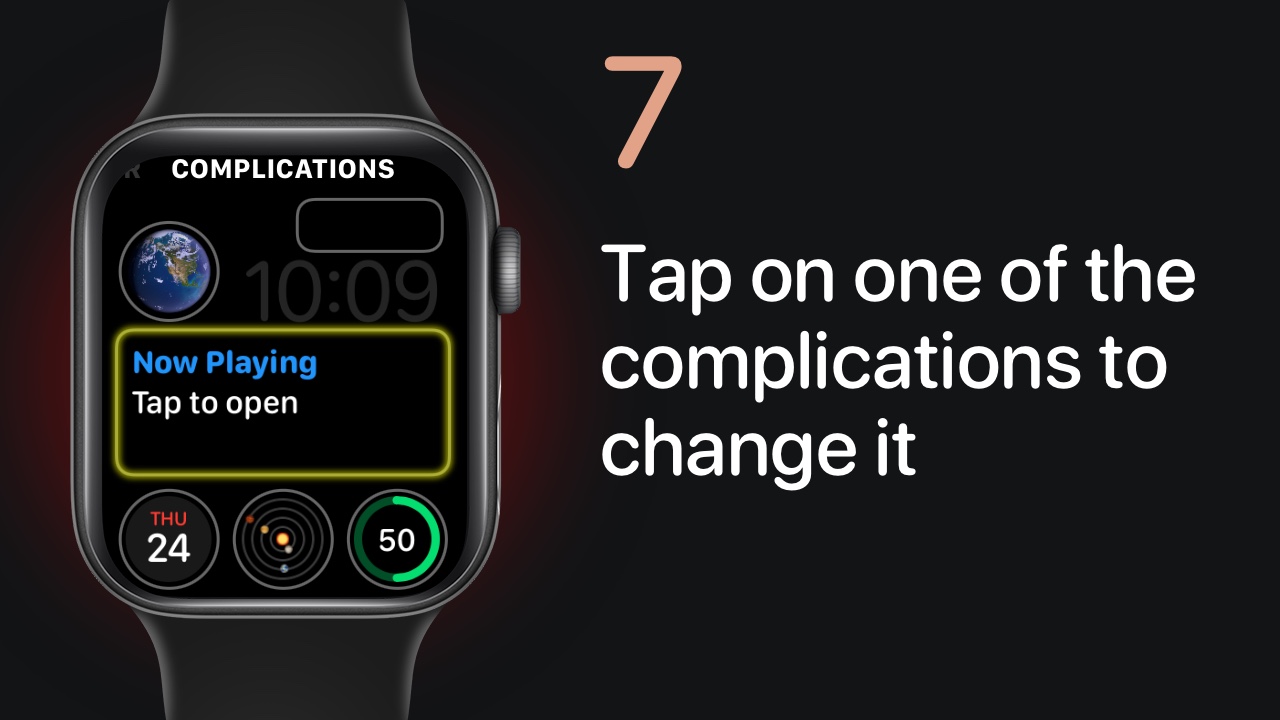
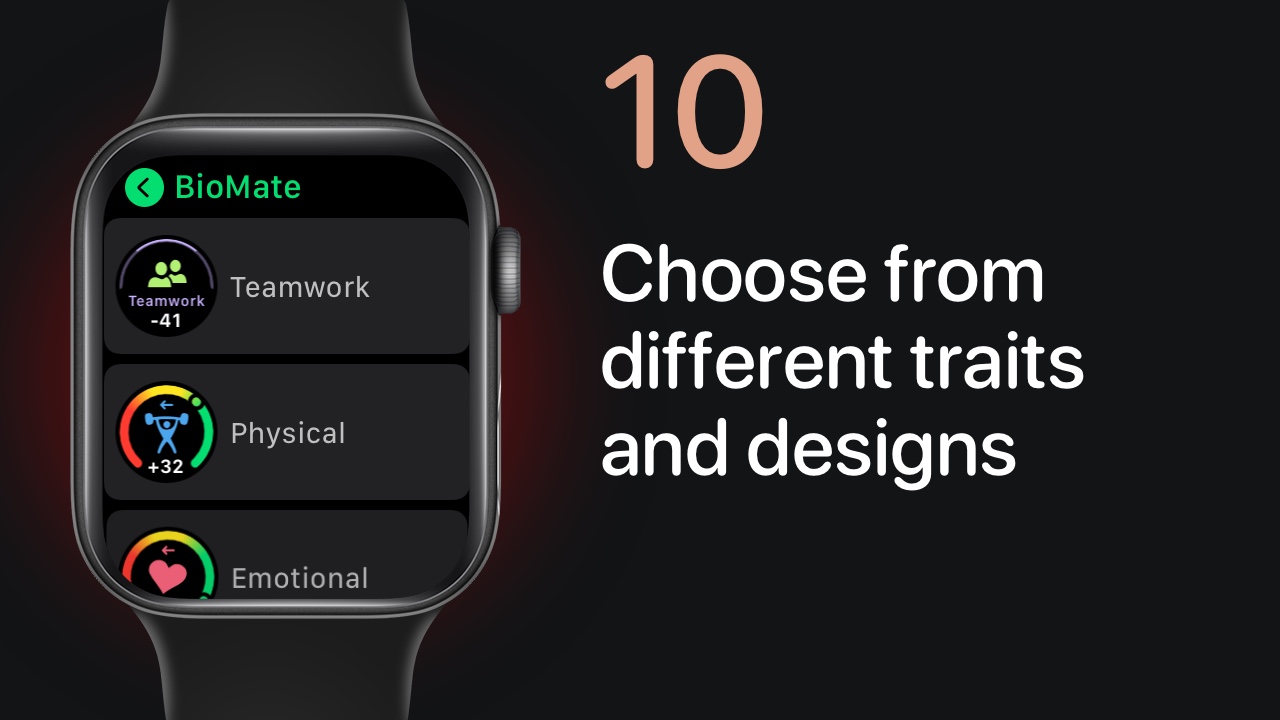
Swipe through these simple steps and learn how to add a new watch face with multiple BioMate complications.
